kerickson
2013-01-25 15:57:30 UTC
kerickson [http://community.zenoss.org/people/kerickson] created the discussion
"Nice, simple, uptime graph"
To view the discussion, visit: http://community.zenoss.org/message/71222#71222
--------------------------------------------------------------
User Gomez over on gmane http://comments.gmane.org/gmane.comp.monitoring.zenoss.user/40771 posted a simple procedure to let you make graphs like this one:
Loading Image...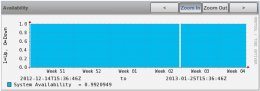 Loading Image...
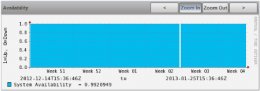
It visually shows availability as measured by the system uptime KPI, and calculates a mean availability for the time period selected. I'll document his steps here in pictures.
Create a new graph. I called mine Availability and put it the /Servers/Linux template, but this procedure will work as-is for any device that has the sysuptime counter.
Loading Image...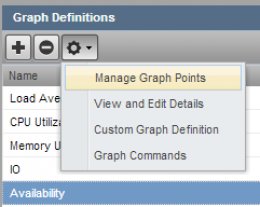 Loading Image...
Start by defining the graph points.
Loading Image... Loading Image...
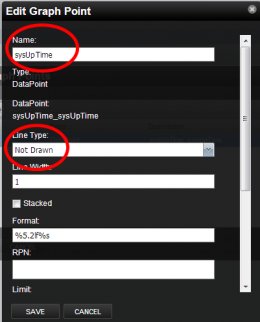
The key here is changing the line type to Not Drawn.
Next, view and edit graph details to set the legend and graph range.
Loading Image... Loading Image...
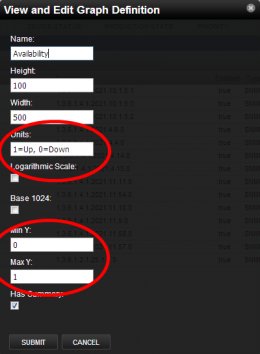
The magic comes in the RRD commands in the custom graph definition.
Loading Image... Loading Image...
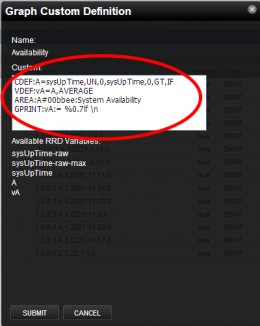
These commands define an area chart based on a simple IF calculation on the uptime metric. For cut-and-paste simplicity, the commands are here:
CDEF:A=sysUpTime,UN,0,sysUpTime,0,GT,IF
VDEF:vA=A,AVERAGE
AREA:A#00bbee:System Availability
GPRINT:vA:= %0.7lf \n
I really like this one!
--------------------------------------------------------------
Reply to this message by replying to this email -or- go to the discussion on Zenoss Community
[http://community.zenoss.org/message/71222#71222]
Start a new discussion in zenoss-users by email
[discussions-community-forums-zenoss--***@community.zenoss.org] -or- at Zenoss Community
[http://community.zenoss.org/choose-container!input.jspa?contentType=1&containerType=14&container=2003]
"Nice, simple, uptime graph"
To view the discussion, visit: http://community.zenoss.org/message/71222#71222
--------------------------------------------------------------
User Gomez over on gmane http://comments.gmane.org/gmane.comp.monitoring.zenoss.user/40771 posted a simple procedure to let you make graphs like this one:
Loading Image...
 Loading Image...
It visually shows availability as measured by the system uptime KPI, and calculates a mean availability for the time period selected. I'll document his steps here in pictures.
Create a new graph. I called mine Availability and put it the /Servers/Linux template, but this procedure will work as-is for any device that has the sysuptime counter.
Loading Image...
 Loading Image...
Start by defining the graph points.
Loading Image...
 Loading Image...
The key here is changing the line type to Not Drawn.
Next, view and edit graph details to set the legend and graph range.
Loading Image...
 Loading Image...
The magic comes in the RRD commands in the custom graph definition.
Loading Image...
 Loading Image...
These commands define an area chart based on a simple IF calculation on the uptime metric. For cut-and-paste simplicity, the commands are here:
CDEF:A=sysUpTime,UN,0,sysUpTime,0,GT,IF
VDEF:vA=A,AVERAGE
AREA:A#00bbee:System Availability
GPRINT:vA:= %0.7lf \n
I really like this one!
--------------------------------------------------------------
Reply to this message by replying to this email -or- go to the discussion on Zenoss Community
[http://community.zenoss.org/message/71222#71222]
Start a new discussion in zenoss-users by email
[discussions-community-forums-zenoss--***@community.zenoss.org] -or- at Zenoss Community
[http://community.zenoss.org/choose-container!input.jspa?contentType=1&containerType=14&container=2003]

