kerickson
2013-01-30 00:13:00 UTC
kerickson [http://community.zenoss.org/people/kerickson] created the discussion
"Change a graph to make the unusual pop out"
To view the discussion, visit: http://community.zenoss.org/message/71284#71284
--------------------------------------------------------------
Let's say you wonder what's happening on a particular device. Pop up the device details screens, look at a graph.
Loading Image...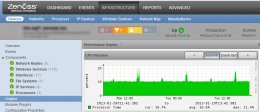 Loading Image...
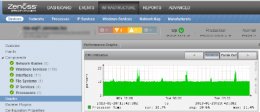
OK, that's nice. But what's different than normal? If you don't work on a device every day you probably won't know.
Let's make the unusual pop out in this graph, by highlighting measurements that are 3 standard deviations out of normal. Which is a statistical way of saying "the top 5% or so."
Drop over into the Monitoring templates, select the graph, and bring up the Custom Graph Definition dialog.
Loading Image...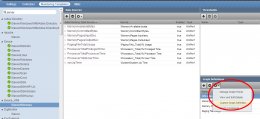 Loading Image...
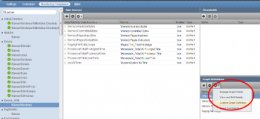
Once you've done that, paste and tweak some RRD commands.
Loading Image...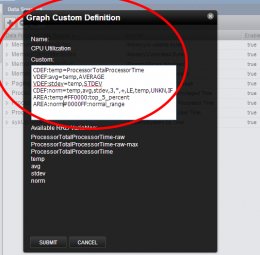 Loading Image...
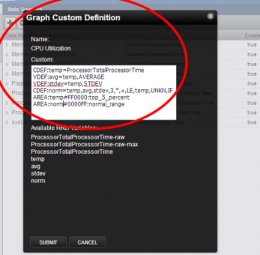
I'll walk thru these.
CDEF:temp=ProcessorTotalProcessorTime
I like to cut and paste my code, so I use a standard variable (here 'temp') in the pasted code, and assign the RRD variable with a CDEF at the top. Makes my life easier.
VDEF:avg=temp,AVERAGE
VDEF:stdev=temp,STDEV
Two RRDtool functions that calculate the average and standard deviation for the data range in the graph.
CDEF:norm=temp,avg,stdev,3,*,+,LE,temp,UNKN,IF
That's a mouthful. It's an RPN function that calculates norm=IF(temp<=(avg+3*stdev)) then temp else UNKN
AREA:temp#FF0000:top_5_percent
AREA:norm#0000FF:normal_range
Draw the top five percent in red using the temp stream, and the rest in blue using the norm stream.
I also go in and set the data point type to not drawn instead of line.
Now when you bring up the chart it's a lot easier to see what's different.
Loading Image... Loading Image...
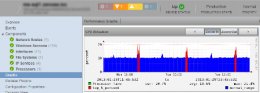
There are regular spikes where something is running hot.
Since the graph is calculated based on the time range displayed, if I zoom out I can see that this started happening fairly recently and very regularly.
Loading Image...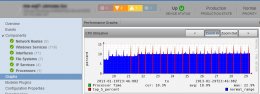 Loading Image...
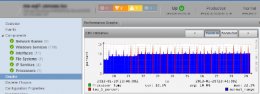
As I keep zooming out, for this server I discover that the last few weeks have been the busiest period in the last six months.
Loading Image...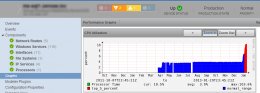 Loading Image...
Zenoss, statistics, and RRDtool can really help you!
I used this http://www.springsurprise.com/2010/11/01/using_vdefs_in_rrdtool/ great article on SpringSurprise to help me with this post. There's more good ideas there!
--------------------------------------------------------------
Reply to this message by replying to this email -or- go to the discussion on Zenoss Community
[http://community.zenoss.org/message/71284#71284]
Start a new discussion in zenoss-users by email
[discussions-community-forums-zenoss--***@community.zenoss.org] -or- at Zenoss Community
[http://community.zenoss.org/choose-container!input.jspa?contentType=1&containerType=14&container=2003]
"Change a graph to make the unusual pop out"
To view the discussion, visit: http://community.zenoss.org/message/71284#71284
--------------------------------------------------------------
Let's say you wonder what's happening on a particular device. Pop up the device details screens, look at a graph.
Loading Image...
 Loading Image...
OK, that's nice. But what's different than normal? If you don't work on a device every day you probably won't know.
Let's make the unusual pop out in this graph, by highlighting measurements that are 3 standard deviations out of normal. Which is a statistical way of saying "the top 5% or so."
Drop over into the Monitoring templates, select the graph, and bring up the Custom Graph Definition dialog.
Loading Image...
 Loading Image...
Once you've done that, paste and tweak some RRD commands.
Loading Image...
 Loading Image...
I'll walk thru these.
CDEF:temp=ProcessorTotalProcessorTime
I like to cut and paste my code, so I use a standard variable (here 'temp') in the pasted code, and assign the RRD variable with a CDEF at the top. Makes my life easier.
VDEF:avg=temp,AVERAGE
VDEF:stdev=temp,STDEV
Two RRDtool functions that calculate the average and standard deviation for the data range in the graph.
CDEF:norm=temp,avg,stdev,3,*,+,LE,temp,UNKN,IF
That's a mouthful. It's an RPN function that calculates norm=IF(temp<=(avg+3*stdev)) then temp else UNKN
AREA:temp#FF0000:top_5_percent
AREA:norm#0000FF:normal_range
Draw the top five percent in red using the temp stream, and the rest in blue using the norm stream.
I also go in and set the data point type to not drawn instead of line.
Now when you bring up the chart it's a lot easier to see what's different.
Loading Image...
 Loading Image...
There are regular spikes where something is running hot.
Since the graph is calculated based on the time range displayed, if I zoom out I can see that this started happening fairly recently and very regularly.
Loading Image...
 Loading Image...
As I keep zooming out, for this server I discover that the last few weeks have been the busiest period in the last six months.
Loading Image...
 Loading Image...
Zenoss, statistics, and RRDtool can really help you!
I used this http://www.springsurprise.com/2010/11/01/using_vdefs_in_rrdtool/ great article on SpringSurprise to help me with this post. There's more good ideas there!
--------------------------------------------------------------
Reply to this message by replying to this email -or- go to the discussion on Zenoss Community
[http://community.zenoss.org/message/71284#71284]
Start a new discussion in zenoss-users by email
[discussions-community-forums-zenoss--***@community.zenoss.org] -or- at Zenoss Community
[http://community.zenoss.org/choose-container!input.jspa?contentType=1&containerType=14&container=2003]