handsy
2013-05-23 12:43:32 UTC
handsy [http://community.zenoss.org/people/handsy] created the discussion
"Cumulative multi-graph report - how?"
To view the discussion, visit: http://community.zenoss.org/message/73319#73319
--------------------------------------------------------------
Hi everyone, I have some multi-graph reports that show individual lines for each interface I've added to the collection (example attached).
What I actually want is for all the values at each timestamp to be cumulated together and shown like that. For example, if I had 2 interfaces being measured at 12:00pm and one reported 1Mbps while the other 2Mbps for that timestamp....rather than me seeing 1 point at 1Mbps and another at 2Mbps, I want a single point at 3Mbps instead.
I'm sure this is possible....I just don't know how.
Any help appreciated as always :)
Loading Image...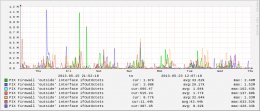 Loading Image...
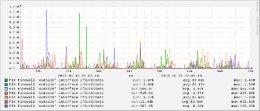
--------------------------------------------------------------
Reply to this message by replying to this email -or- go to the discussion on Zenoss Community
[http://community.zenoss.org/message/73319#73319]
Start a new discussion in zenoss-users at Zenoss Community
[http://community.zenoss.org/choose-container!input.jspa?contentType=1&containerType=14&container=2003]
"Cumulative multi-graph report - how?"
To view the discussion, visit: http://community.zenoss.org/message/73319#73319
--------------------------------------------------------------
Hi everyone, I have some multi-graph reports that show individual lines for each interface I've added to the collection (example attached).
What I actually want is for all the values at each timestamp to be cumulated together and shown like that. For example, if I had 2 interfaces being measured at 12:00pm and one reported 1Mbps while the other 2Mbps for that timestamp....rather than me seeing 1 point at 1Mbps and another at 2Mbps, I want a single point at 3Mbps instead.
I'm sure this is possible....I just don't know how.
Any help appreciated as always :)
Loading Image...
 Loading Image...
--------------------------------------------------------------
Reply to this message by replying to this email -or- go to the discussion on Zenoss Community
[http://community.zenoss.org/message/73319#73319]
Start a new discussion in zenoss-users at Zenoss Community
[http://community.zenoss.org/choose-container!input.jspa?contentType=1&containerType=14&container=2003]