James Stewart
2011-12-05 04:25:30 UTC
James Stewart [http://community.zenoss.org/people/amorphic] created the discussion
"Delay between FS threshold breach and event"
To view the discussion, visit: http://community.zenoss.org/message/63034#63034
--------------------------------------------------------------
Hello all,
I have just experienced a strange problem. A filesystem on one of our Linux servers started to fill up, eventually breaching first its Error threshold @ 12:45 and then its Critical threshold @ 12:55. This can be seen in the graph for the filesystem in question:
Loading Image... Loading Image...
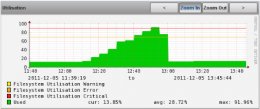
However, we did not receive any events for the Error threshold breach. We did receive a single event for the Critical threshold breach, but this did not arrive until about 40 mins after the breach occured, (this was subsequently auto-cleared):
Loading Image...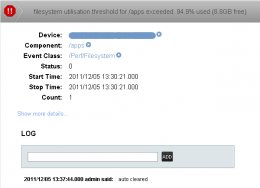 Loading Image...
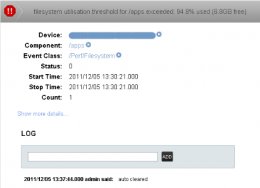
As the filesystem usage is graphed in Zenoss and I do not see any errors for this host in zenperfsnnpd.log, I can only assume that the data was correctly collected via zenperfsnmpd.
So, can anybody suggest why this delay between the threshold breach and resulting event may have occured? There was no unusual load on my Zenoss server at the time and I have not seen any problems like this previously.
Failing that, any suggestions as to where I might look for futher clues?
Cheers,
James
--------------------------------------------------------------
Reply to this message by replying to this email -or- go to the discussion on Zenoss Community
[http://community.zenoss.org/message/63034#63034]
Start a new discussion in zenoss-users by email
[discussions-community-forums-zenoss--***@community.zenoss.org] -or- at Zenoss Community
[http://community.zenoss.org/choose-container!input.jspa?contentType=1&containerType=14&container=2003]
"Delay between FS threshold breach and event"
To view the discussion, visit: http://community.zenoss.org/message/63034#63034
--------------------------------------------------------------
Hello all,
I have just experienced a strange problem. A filesystem on one of our Linux servers started to fill up, eventually breaching first its Error threshold @ 12:45 and then its Critical threshold @ 12:55. This can be seen in the graph for the filesystem in question:
Loading Image...
 Loading Image...
However, we did not receive any events for the Error threshold breach. We did receive a single event for the Critical threshold breach, but this did not arrive until about 40 mins after the breach occured, (this was subsequently auto-cleared):
Loading Image...
 Loading Image...
As the filesystem usage is graphed in Zenoss and I do not see any errors for this host in zenperfsnnpd.log, I can only assume that the data was correctly collected via zenperfsnmpd.
So, can anybody suggest why this delay between the threshold breach and resulting event may have occured? There was no unusual load on my Zenoss server at the time and I have not seen any problems like this previously.
Failing that, any suggestions as to where I might look for futher clues?
Cheers,
James
--------------------------------------------------------------
Reply to this message by replying to this email -or- go to the discussion on Zenoss Community
[http://community.zenoss.org/message/63034#63034]
Start a new discussion in zenoss-users by email
[discussions-community-forums-zenoss--***@community.zenoss.org] -or- at Zenoss Community
[http://community.zenoss.org/choose-container!input.jspa?contentType=1&containerType=14&container=2003]