Pete Starnes
2012-09-07 18:49:43 UTC
Pete Starnes [http://community.zenoss.org/people/pstarnes] created the discussion
"Custom Monitoring Template with -NAN Graphs"
To view the discussion, visit: http://community.zenoss.org/message/68447#68447
--------------------------------------------------------------
Let me start by saying that I have read the appropriate documenation and searched these forums for an answer to my problem. I feel like it is something very simple that I am missing and/or not understanding but for the life of me I have not been able to figure it out over the last several days.
I have a fresh install of Zenoss Core 4.2.0 and it is working fine. I have been able to graph all the standard types of devices (cisco routers, switches, etc) without any problems at all. The problem I am having is when I try to import a vendor MiB to graph some non-standard devices (PtP Microwave radios by Exalt Communications). I can create the monitoring templates but my graphs always show -NAN as the values even though the "Test" works and returns the correct values. Here are the steps I have taken with screenshots:
I download the MiBs file from Exalt Communications website for my devices. I then imported the MiBs into Zenoss by uploading them to my server with WinSCP to the /opt/zenoss/share/mibs/site directory following these instructions: http://www.zenoss.co.uk/mibs.htm http://www.zenoss.co.uk/mibs.htm
The Mibs show up in the Web GUI under Advanced->MIBs as shown here:
Loading Image...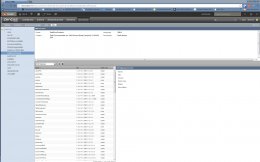 Loading Image...
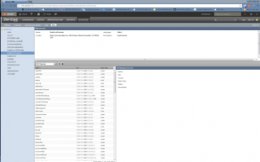
Loading Image... Loading Image...
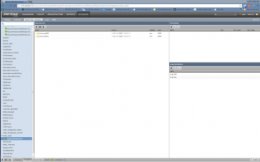
I added a Data Source to the template by clicking on the Plus sign under Data Sources and naming it locCurrentBER and giving it a type of SNMP.
I edited the Data Source and entered the OID as such:
Loading Image...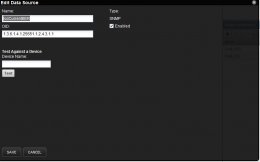 Loading Image...
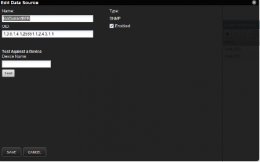
I entered the Device IP address and clicked on Test which worked:
Loading Image...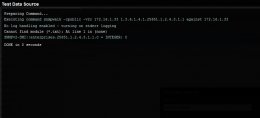 Loading Image...
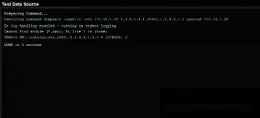
I then added a Data Point by clicking ont he Gear under Data Sources and gave it the name of locCurrentBER with RRD Type of GAUGE as shown here:
Loading Image...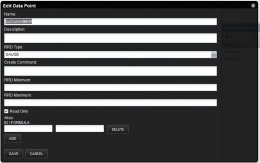 Loading Image...
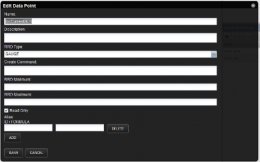
I then created a Graph Definition by clicking on the plus symbol in the Graph Definitions frame and gave it a name of Exalt_BER. Then I highlighted Exalt_BER and clicked on the Gear and selected Manage Graph Points. From there I clicked on the plus symbol and selected Data Point. In the drop down box I selected my Data Source of locCurrentBER.locCurrentBER. Here is a view of the details:
Loading Image...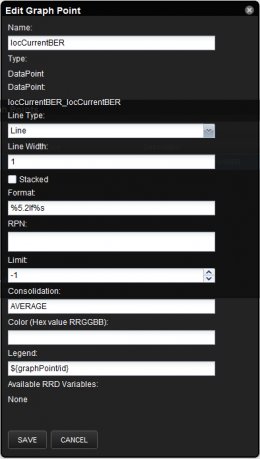 Loading Image...
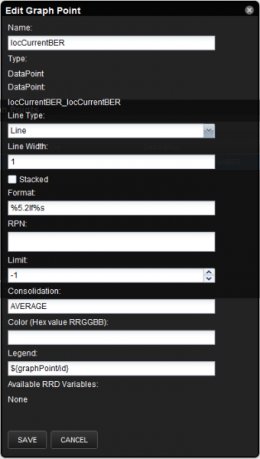
And here is a view of the Graph Details:
Loading Image...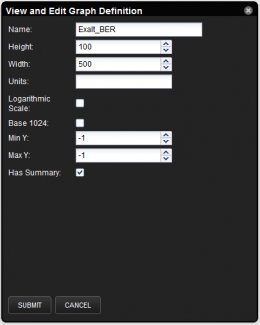 Loading Image...
I then restarted the Zenoss Services by type service zenoss restart at the command prompt and waited for all services to come back up.Â
Now I navigated to Infrustructre->Devices and selected the Computer with the plus symbol drop down and selected add a single device.
I entered the IP address of the device and set the Device class to /Network/Radio/Exalt
Loading Image...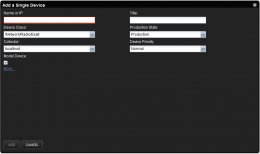 Loading Image...
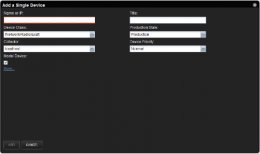
I then waited and under Components I can see my Network Routes and Interfaces. My interfaces are graphing fine. Under Graphs I now have the Graph Exalt_BER and the time stamps on it update but the values always show -nan. I have rebooted the server and waited for 24 hours with no update in values.
Loading Image...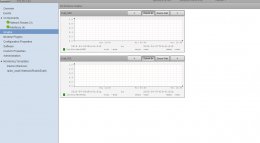 Loading Image...
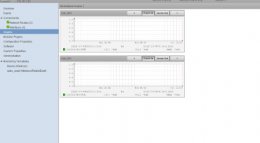
What is it that I am missing? I'm sure it must be something simple that I have overlooked but I can not for the life of me figure it out. I would greatly appreciate any help that you can provide me with.
Thanks!
--------------------------------------------------------------
Reply to this message by replying to this email -or- go to the discussion on Zenoss Community
[http://community.zenoss.org/message/68447#68447]
Start a new discussion in zenoss-users by email
[discussions-community-forums-zenoss--***@community.zenoss.org] -or- at Zenoss Community
[http://community.zenoss.org/choose-container!input.jspa?contentType=1&containerType=14&container=2003]
"Custom Monitoring Template with -NAN Graphs"
To view the discussion, visit: http://community.zenoss.org/message/68447#68447
--------------------------------------------------------------
Let me start by saying that I have read the appropriate documenation and searched these forums for an answer to my problem. I feel like it is something very simple that I am missing and/or not understanding but for the life of me I have not been able to figure it out over the last several days.
I have a fresh install of Zenoss Core 4.2.0 and it is working fine. I have been able to graph all the standard types of devices (cisco routers, switches, etc) without any problems at all. The problem I am having is when I try to import a vendor MiB to graph some non-standard devices (PtP Microwave radios by Exalt Communications). I can create the monitoring templates but my graphs always show -NAN as the values even though the "Test" works and returns the correct values. Here are the steps I have taken with screenshots:
I download the MiBs file from Exalt Communications website for my devices. I then imported the MiBs into Zenoss by uploading them to my server with WinSCP to the /opt/zenoss/share/mibs/site directory following these instructions: http://www.zenoss.co.uk/mibs.htm http://www.zenoss.co.uk/mibs.htm
The Mibs show up in the Web GUI under Advanced->MIBs as shown here:
Loading Image...
 Loading Image...
Loading Image...
 Loading Image...
I added a Data Source to the template by clicking on the Plus sign under Data Sources and naming it locCurrentBER and giving it a type of SNMP.
I edited the Data Source and entered the OID as such:
Loading Image...
 Loading Image...
I entered the Device IP address and clicked on Test which worked:
Loading Image...
 Loading Image...
I then added a Data Point by clicking ont he Gear under Data Sources and gave it the name of locCurrentBER with RRD Type of GAUGE as shown here:
Loading Image...
 Loading Image...
I then created a Graph Definition by clicking on the plus symbol in the Graph Definitions frame and gave it a name of Exalt_BER. Then I highlighted Exalt_BER and clicked on the Gear and selected Manage Graph Points. From there I clicked on the plus symbol and selected Data Point. In the drop down box I selected my Data Source of locCurrentBER.locCurrentBER. Here is a view of the details:
Loading Image...
 Loading Image...
And here is a view of the Graph Details:
Loading Image...
 Loading Image...
I then restarted the Zenoss Services by type service zenoss restart at the command prompt and waited for all services to come back up.Â
Now I navigated to Infrustructre->Devices and selected the Computer with the plus symbol drop down and selected add a single device.
I entered the IP address of the device and set the Device class to /Network/Radio/Exalt
Loading Image...
 Loading Image...
I then waited and under Components I can see my Network Routes and Interfaces. My interfaces are graphing fine. Under Graphs I now have the Graph Exalt_BER and the time stamps on it update but the values always show -nan. I have rebooted the server and waited for 24 hours with no update in values.
Loading Image...
 Loading Image...
What is it that I am missing? I'm sure it must be something simple that I have overlooked but I can not for the life of me figure it out. I would greatly appreciate any help that you can provide me with.
Thanks!
--------------------------------------------------------------
Reply to this message by replying to this email -or- go to the discussion on Zenoss Community
[http://community.zenoss.org/message/68447#68447]
Start a new discussion in zenoss-users by email
[discussions-community-forums-zenoss--***@community.zenoss.org] -or- at Zenoss Community
[http://community.zenoss.org/choose-container!input.jspa?contentType=1&containerType=14&container=2003]