Matthew Butt
2012-11-21 14:17:00 UTC
Matthew Butt [http://community.zenoss.org/people/NetwiseHosting] created the discussion
"Cisco Switch Graphing Issues"
To view the discussion, visit: http://community.zenoss.org/message/70037#70037
--------------------------------------------------------------
Hi there,
I have been using Zenoss for a few months now, which keeps an eye on infrastructure in our data centre for us. It has been working well, all bar one issue which has been perplexing me for some time. A while back, I noticed something a little strange on the graphs for interfaces on our Cisco switches;
On all downlink interfaces (i.e. interfaces facing servers), it appears as though the inbound and outbound traffic data on the graphs is inverted.
I have confirmed this by running a download test on a spare port and monitoring its graph. Despite downloading on the test machine at 20Mbps, the graphs show outbound traffic of 20Mbps, and negligible inbound traffic.
On uplink ports, the order seems fine (i.e. inbound is inbound, outbound is outbound). You can see the same traffic passing through the uplink to the core switches, which displays as desired. Interestingly, on the core switch itself, the other end of the uplink (i.e. the downlink on the core) is also inverted, with inbound showing as outbound and vice versa.
Below you will see a screenshot of the graph for the test interface, during which time I had been downloading files, NOT uploading as the graph suggests.
Loading Image...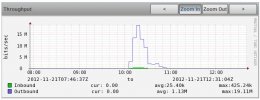 Loading Image...
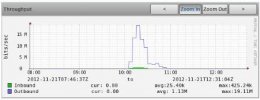
Below now you will see one of the uplink interfaces to the core, which shows the correct orientation. I realise this also has the collective traffic of all interfaces on the switch, however you can see my test quite clearly.
Loading Image...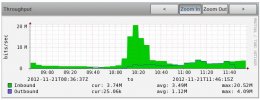 Loading Image...
The links between the core and the edge switches are etherchannels, though this problem existed before these were put in place.
I am struggling to see *A) why this is happening at all, and B) how I can resolve it.*
Any advice would be greatly appreciated, as although I know the graphs data points are simply the wrong way round on downlinks, it can make reading them a bit of a challenge, particularly when switching between an uplink interface that graphs correctly, and a downlink that does not.
I think I either need to swap the data points on graphs, but only for certain interfaces on certain devices (is this possible?), or perhaps find another fix?
Thanks, Matt.
--------------------------------------------------------------
Reply to this message by replying to this email -or- go to the discussion on Zenoss Community
[http://community.zenoss.org/message/70037#70037]
Start a new discussion in zenoss-users by email
[discussions-community-forums-zenoss--***@community.zenoss.org] -or- at Zenoss Community
[http://community.zenoss.org/choose-container!input.jspa?contentType=1&containerType=14&container=2003]
"Cisco Switch Graphing Issues"
To view the discussion, visit: http://community.zenoss.org/message/70037#70037
--------------------------------------------------------------
Hi there,
I have been using Zenoss for a few months now, which keeps an eye on infrastructure in our data centre for us. It has been working well, all bar one issue which has been perplexing me for some time. A while back, I noticed something a little strange on the graphs for interfaces on our Cisco switches;
On all downlink interfaces (i.e. interfaces facing servers), it appears as though the inbound and outbound traffic data on the graphs is inverted.
I have confirmed this by running a download test on a spare port and monitoring its graph. Despite downloading on the test machine at 20Mbps, the graphs show outbound traffic of 20Mbps, and negligible inbound traffic.
On uplink ports, the order seems fine (i.e. inbound is inbound, outbound is outbound). You can see the same traffic passing through the uplink to the core switches, which displays as desired. Interestingly, on the core switch itself, the other end of the uplink (i.e. the downlink on the core) is also inverted, with inbound showing as outbound and vice versa.
Below you will see a screenshot of the graph for the test interface, during which time I had been downloading files, NOT uploading as the graph suggests.
Loading Image...
 Loading Image...
Below now you will see one of the uplink interfaces to the core, which shows the correct orientation. I realise this also has the collective traffic of all interfaces on the switch, however you can see my test quite clearly.
Loading Image...
 Loading Image...
The links between the core and the edge switches are etherchannels, though this problem existed before these were put in place.
I am struggling to see *A) why this is happening at all, and B) how I can resolve it.*
Any advice would be greatly appreciated, as although I know the graphs data points are simply the wrong way round on downlinks, it can make reading them a bit of a challenge, particularly when switching between an uplink interface that graphs correctly, and a downlink that does not.
I think I either need to swap the data points on graphs, but only for certain interfaces on certain devices (is this possible?), or perhaps find another fix?
Thanks, Matt.
--------------------------------------------------------------
Reply to this message by replying to this email -or- go to the discussion on Zenoss Community
[http://community.zenoss.org/message/70037#70037]
Start a new discussion in zenoss-users by email
[discussions-community-forums-zenoss--***@community.zenoss.org] -or- at Zenoss Community
[http://community.zenoss.org/choose-container!input.jspa?contentType=1&containerType=14&container=2003]